

Construction Portfolio Management
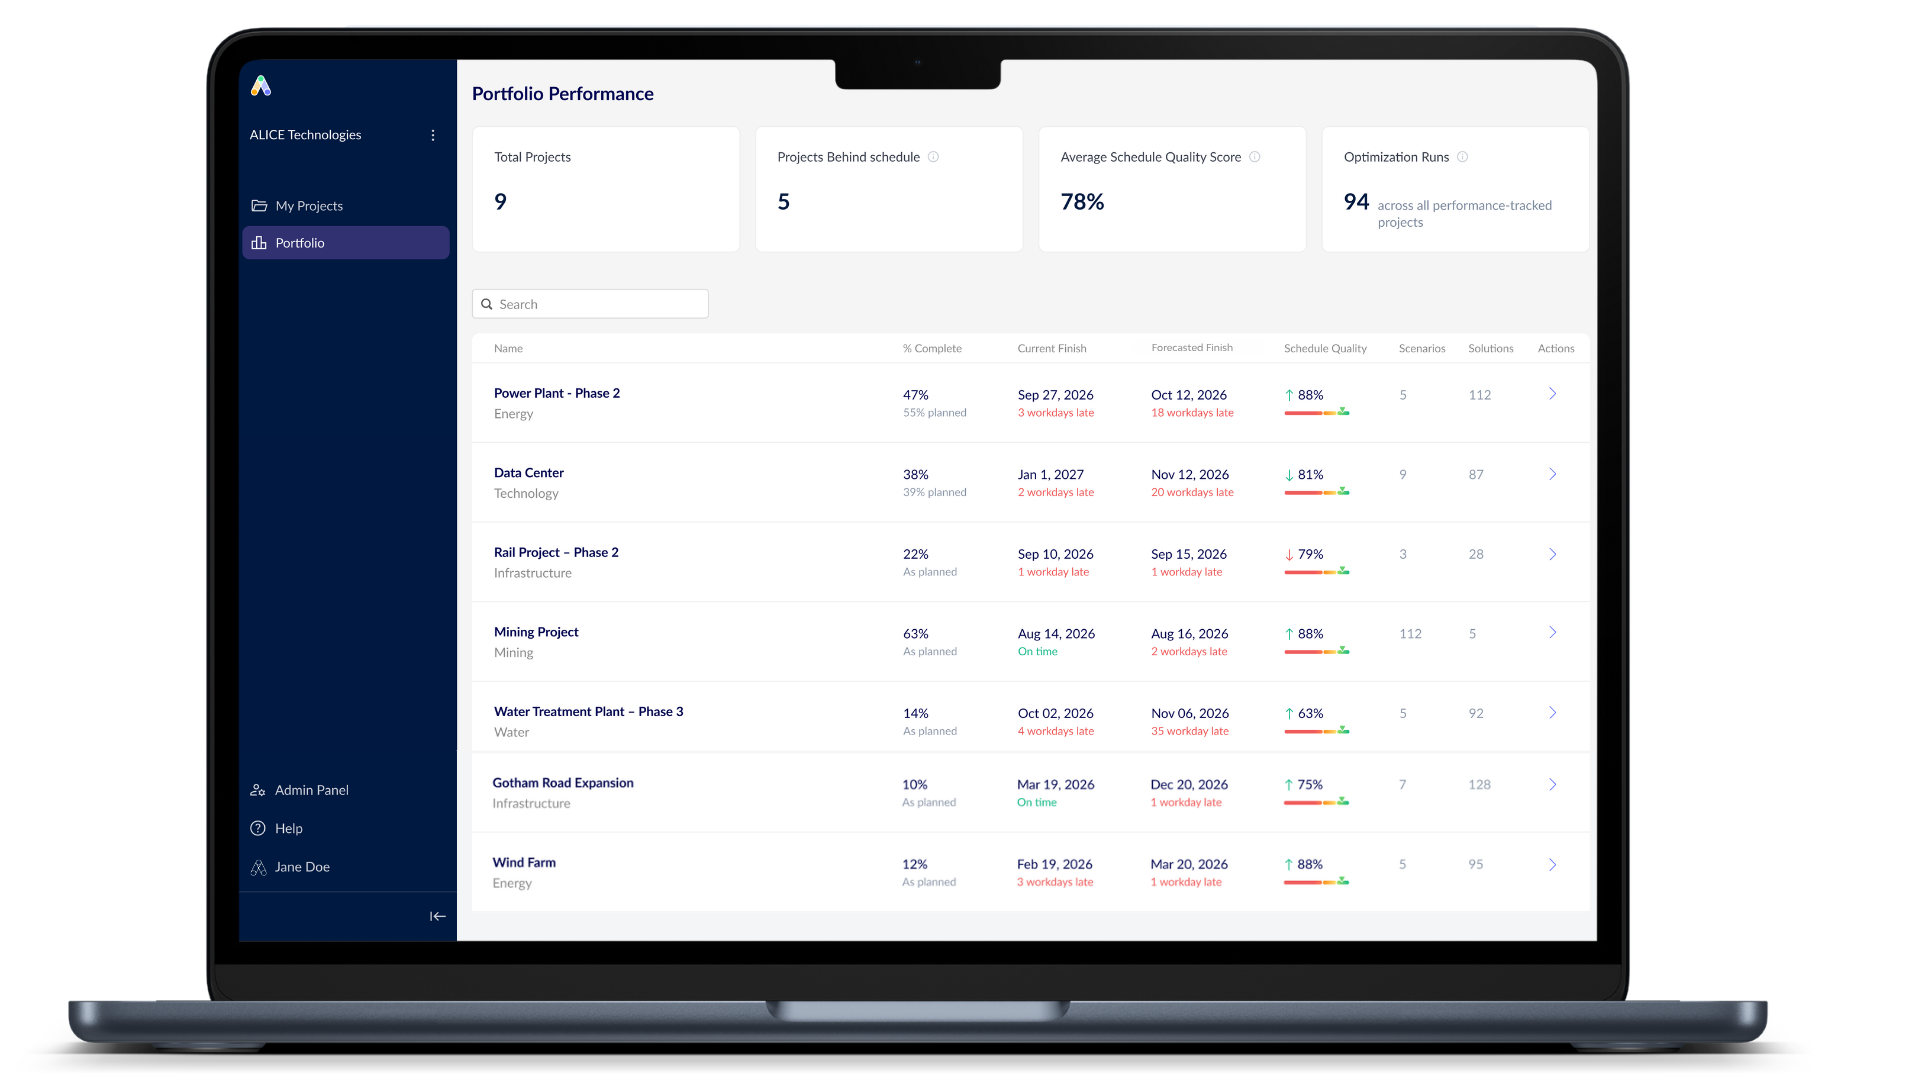

Standardize Portfolio Health
Compare projects side-by-side using unified health and risk metrics. Instantly spot variance and know exactly which projects are holding the baseline and which require executive intervention.
.png?width=35&height=35&name=puzzle%20(1).png)
Pair Insight with Action

Mitigate Systemic Risk
Identify macro-trends and bottlenecks across your business unit or region. Drill down into any single project instantly to review recovery scenarios and protect margins throughout the enterprise.
Positioned directly at the top of your executive view, these automated summary cards deliver an instant snapshot of your entire operation's health the moment teams update their individual schedules.
- Total Active Projects: Tracks the full count of performance-monitored projects across your enterprise in real time.
- Average % Complete vs. Plan: Measures overall portfolio progress against baseline expectations to gauge high-level delivery velocity.
- Projects Behind Baseline: Flags the exact number of lagging projects and quantifies schedule slippage before minor delays compound.
- Total Portfolio Optimizations: Highlights the total volume of AI scenario runs deployed across your projects to evaluate recovery options.
.png?width=2000&name=Project%20Perf%20KPI%20(5).png)
Bridge the gap between macro oversight and micro execution. Click any project directly from the master list to instantly open its dedicated Project Intelligence dashboard and review how the project is tracking against the baseline.
.png?width=2000&name=Project%20Perf%20KPI%20(2).png)

Executive
Dashboard
A centralized overview of your entire project portfolio to monitor high-level health and performance.

Performance Summary Cards

At-a-Glance
Project Health
A master list tracking real-time status, percent complete, exact days behind, and schedule quality scores side-by-side.

ALICE Optimization Metrics
Track project team engagement by seeing exactly how many AI-driven recovery scenarios have been run to mitigate delays.

UPCOMING WEBINAR
Deep Dive into Targeted Optimization
Stop guessing which tasks will move the needle. Join our upcoming live demo to see how ALICE’s new Targeted Optimization mode identifies the fastest, least disruptive path to your project milestones. Built for the whole project team—not just schedulers—this session shows you how to recover time and accelerate schedules at any planning stage.

Optimize every construction phase with ALICE
ALICE gives you new planning and construction super powers.


Targeted Optimization
Identify where your schedule can be accelerated & by how much.

Analytics and Reporting
Track and analyze information that matters most to you.

Schedule Quality Score
Check your schedule score & know exactly what to fix & why.

Schedule Insights Agent
"Chat" with your schedule to get insights & recommendations.

Construction Sequencing
Solve complex constraints & intelligently sequence activities.

Construction Simulation
Explore numerous ways to build your project.

Optimization Presets
Fine-tune an ALICE simulation based on your project goals.

Risk Management
De-risk your project by modeling constraints and scenarios with AI.
Overview of Project Performance
Real-time schedule tracking against baseline. Get KPI cards, risk flags, and production-based forecasts with every upload — and compare recovery options on one chart to get back on track fast.
%20(1).png?width=1920&height=1080&name=ALICE%20Optimize%20(1)%20(1).png)
OVERVIEW OF ALICE OPTIMIZE
There's always more than one way to build. Learn how ALICE Optimize runs AI-powered what-if scenarios on your existing schedule and surfaces risk-reduced solutions against your project goals.
.png?width=573&height=315&name=ALICE%20One%20Pager%20thumbnails%20%20%20%E2%80%93%20final%20(1).png)
The ALICE Playbook for AI Transformation
Less than 20% of construction companies use AI today. This playbook, built on real transformations at top firms, shows you how to pilot fast, win buy-in, and scale AI where it counts most.